HSGP#
- pydantic model pymc_marketing.mmm.hsgp.HSGP[source]#
HSGP component.
Examples
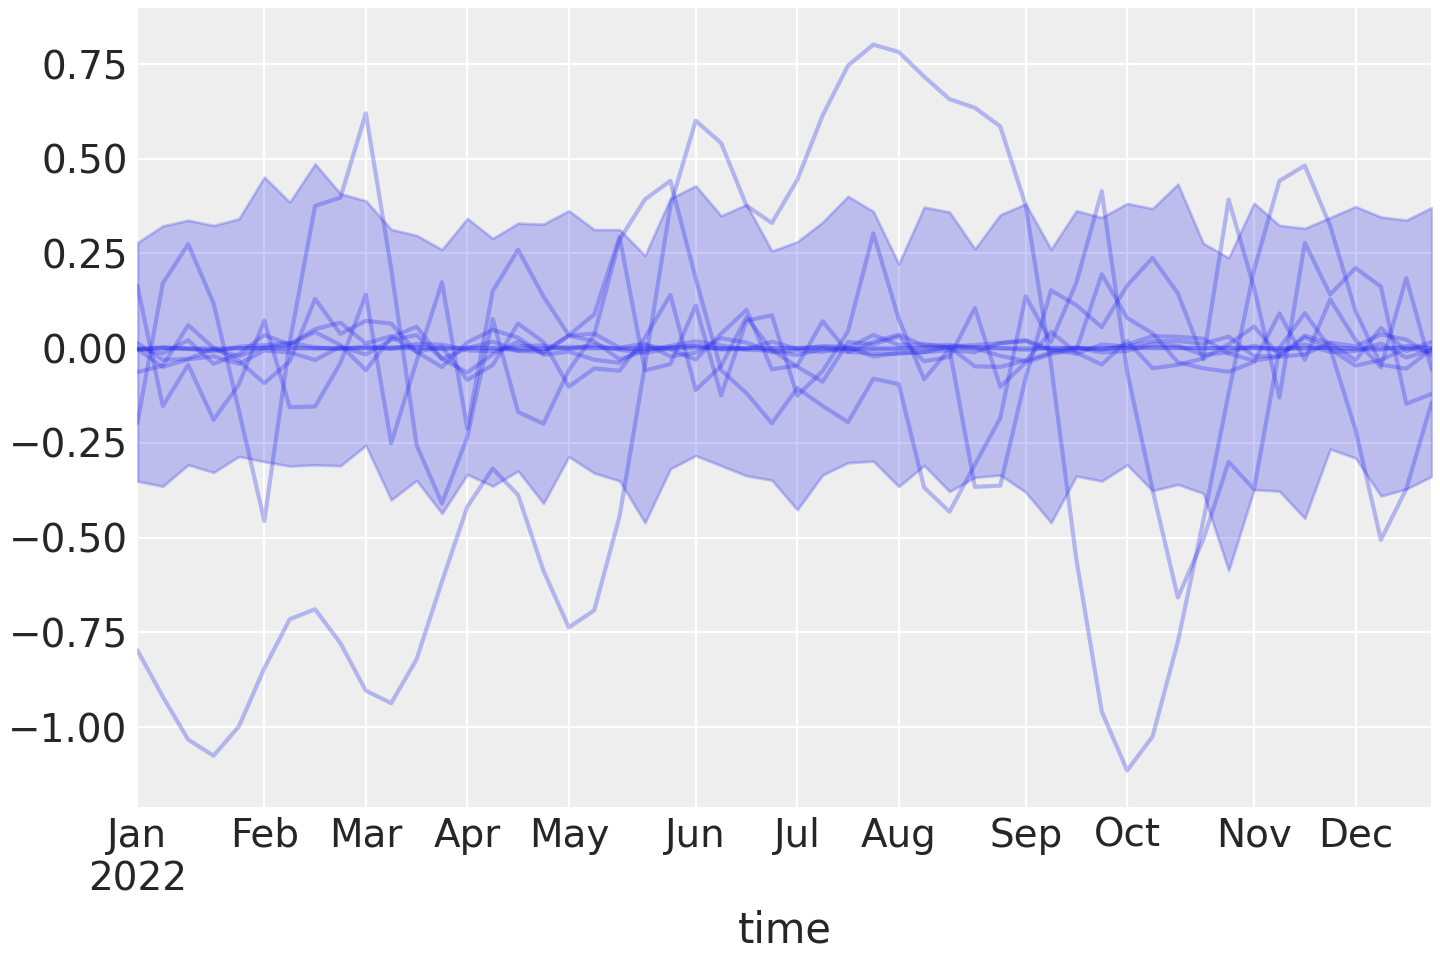
Literature recommended HSGP configuration:
import numpy as np
import pandas as pd

import matplotlib.pyplot as plt

from pymc_marketing.mmm import HSGP

seed = sum(map(ord, "Out of the box GP"))
rng = np.random.default_rng(seed)

n = 52
X = np.arange(n)

hsgp = HSGP.parameterize_from_data(
    X=X,
    dims="time",
)

dates = pd.date_range("2022-01-01", periods=n, freq="W-MON")
coords = {
    "time": dates,
}
prior = hsgp.sample_prior(coords=coords, random_seed=rng)
curve = prior["f"]
hsgp.plot_curve(curve, random_seed=rng)
plt.show()
(
Source code,png,hires.png,pdf)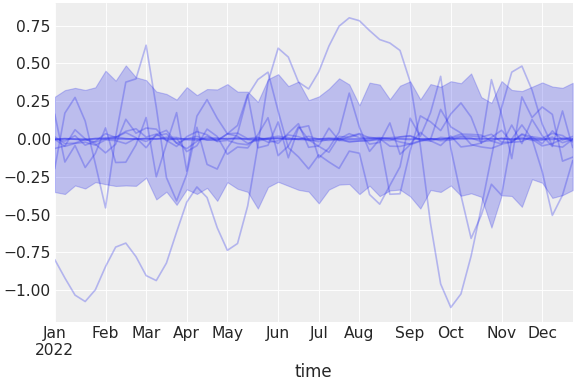
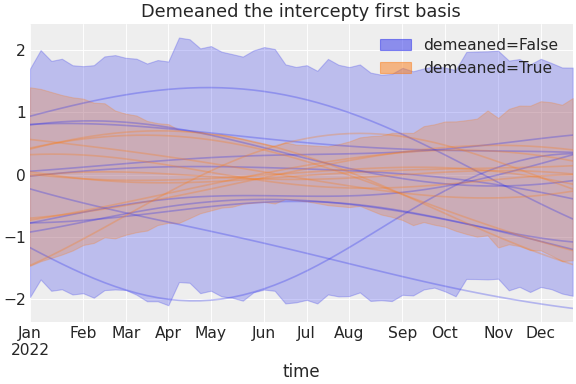
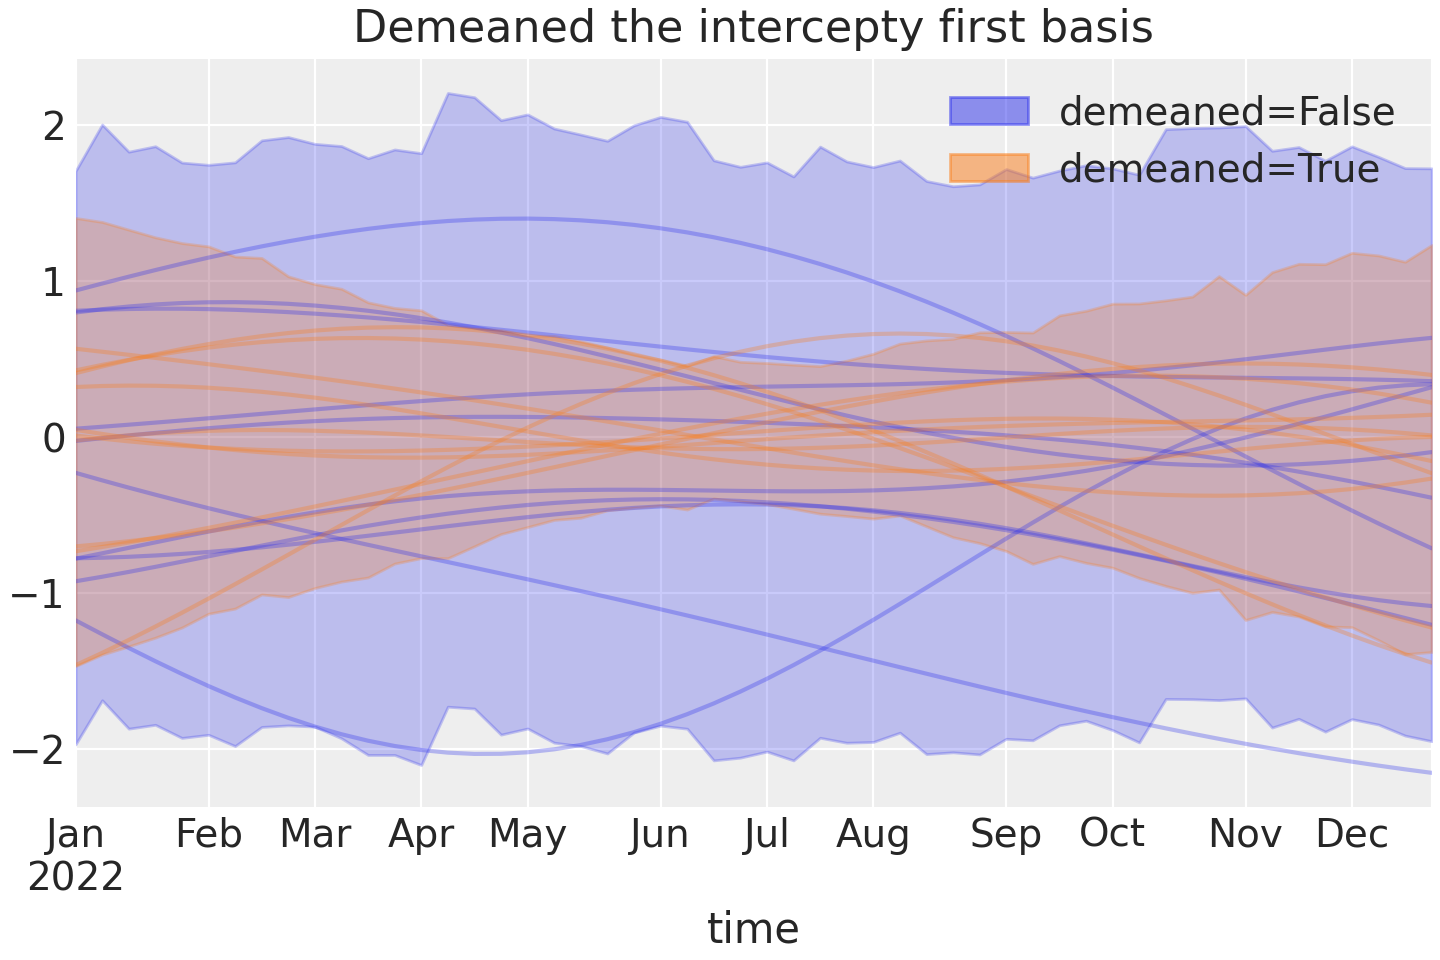
Using a demeaned basis to remove “intercept” effect of first basis:
import numpy as np
import pandas as pd
import xarray as xr

import matplotlib.pyplot as plt

from pymc_marketing.mmm import HSGP
from pymc_marketing.plot import plot_curve

seed = sum(map(ord, "Out of the box GP"))
rng = np.random.default_rng(seed)

n = 52
X = np.arange(n)

kwargs = dict(X=X, ls=25, eta=1, dims="time", m=200, L=150, drop_first=False)

hsgp = HSGP(demeaned_basis=False, **kwargs)
hsgp_demeaned = HSGP(demeaned_basis=True, **kwargs)

dates = pd.date_range("2022-01-01", periods=n, freq="W-MON")
coords = {"time": dates}

def sample_curve(hsgp):
    return hsgp.sample_prior(coords=coords, random_seed=rng)["f"]

non_demeaned = sample_curve(hsgp).rename("False")
demeaned = sample_curve(hsgp_demeaned).rename("True")

combined = xr.merge([non_demeaned, demeaned]).to_array("demeaned")
_, axes = combined.pipe(plot_curve, "time", same_axes=True)
axes[0].set(title="Demeaned the intercepty first basis")
plt.show()
(
Source code,png,hires.png,pdf)
HSGP with different covariance function
import numpy as np
import pandas as pd

import matplotlib.pyplot as plt

from pymc_marketing.mmm import HSGP

seed = sum(map(ord, "Change of covariance function"))
rng = np.random.default_rng(seed)

n = 52
X = np.arange(n)

hsgp = HSGP.parameterize_from_data(
    X=X,
    cov_func="matern32",
    dims="time",
)

dates = pd.date_range("2022-01-01", periods=n, freq="W-MON")
coords = {
    "time": dates,
}
prior = hsgp.sample_prior(coords=coords, random_seed=rng)
curve = prior["f"]
hsgp.plot_curve(curve, random_seed=rng)
plt.show()
(
Source code,png,hires.png,pdf)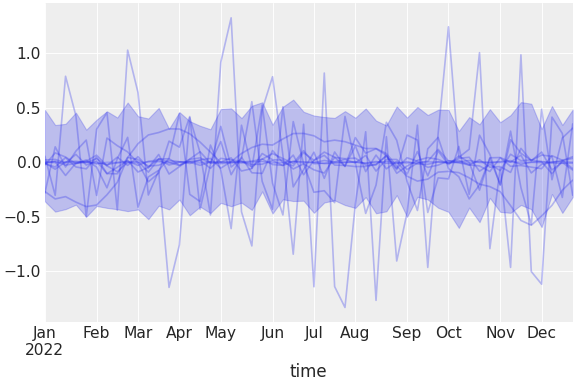
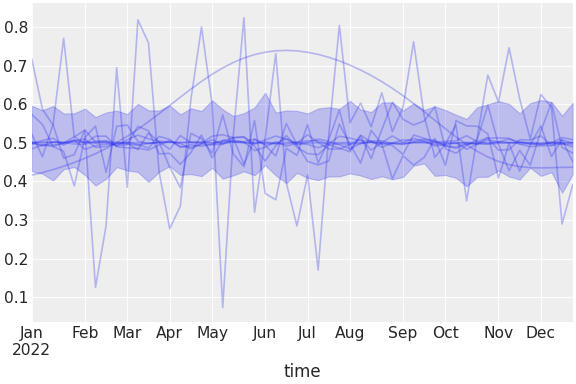
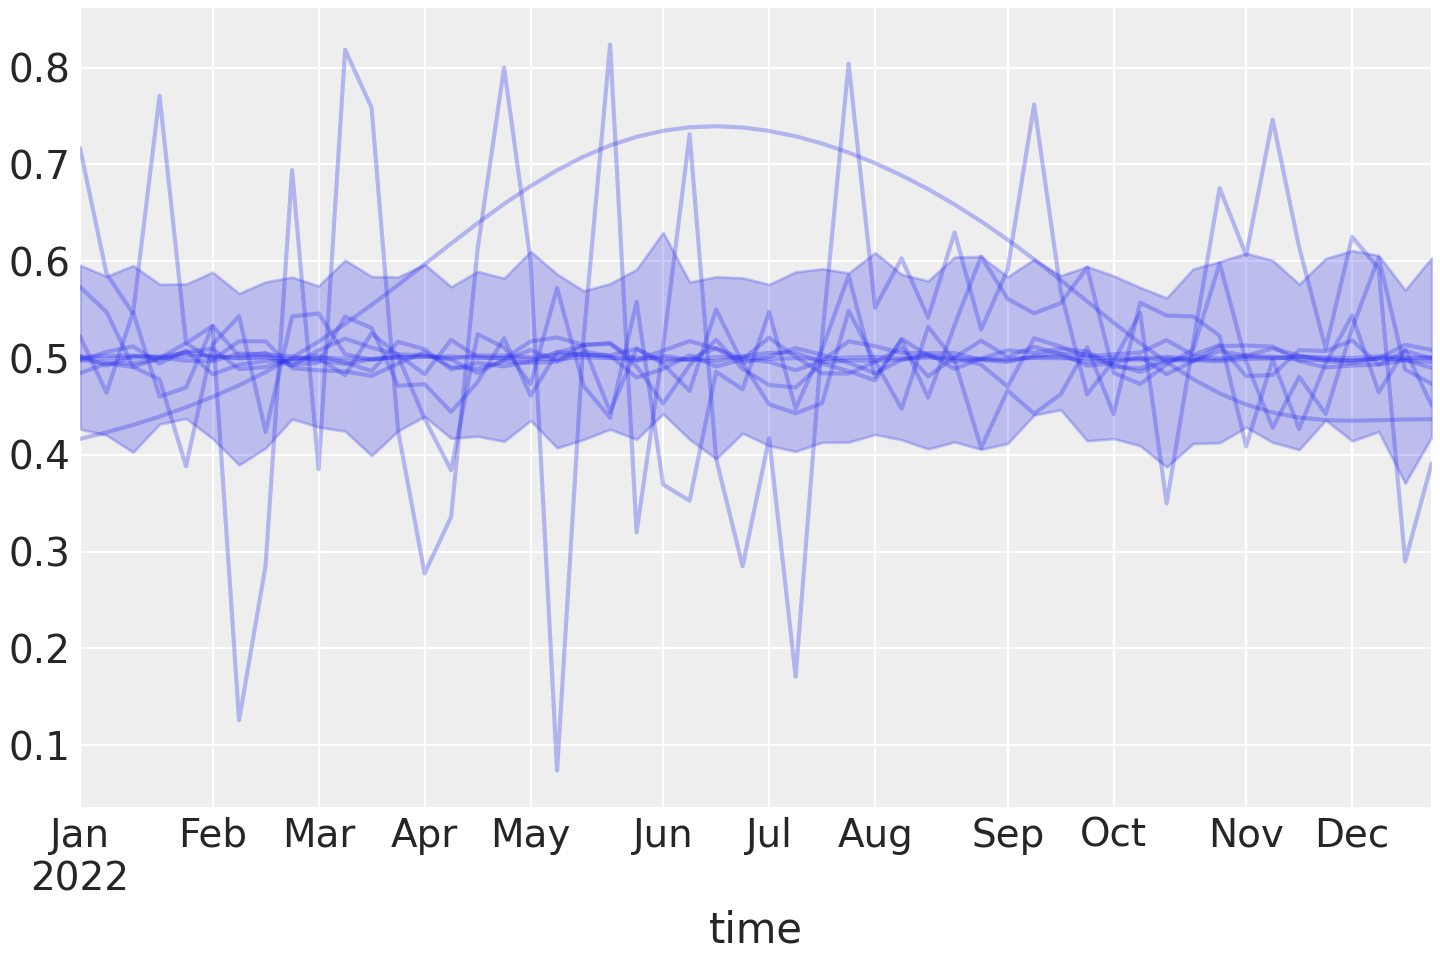
HSGP with different link function via
transformargumentNote
The
transformparameter must be registered or from eitherpytensor.tensororpymc.mathnamespaces. See thepymc_extras.prior.register_tensor_transform()import numpy as np import pandas as pd import matplotlib.pyplot as plt from pymc_marketing.mmm import HSGP seed = sum(map(ord, "Change of covariance function")) rng = np.random.default_rng(seed) n = 52 X = np.arange(n) hsgp = HSGP.parameterize_from_data( X=X, dims="time", transform="sigmoid", ) dates = pd.date_range("2022-01-01", periods=n, freq="W-MON") coords = { "time": dates, } prior = hsgp.sample_prior(coords=coords, random_seed=rng) curve = prior["f"] hsgp.plot_curve(curve, random_seed=rng) plt.show()
(
Source code,png,hires.png,pdf)
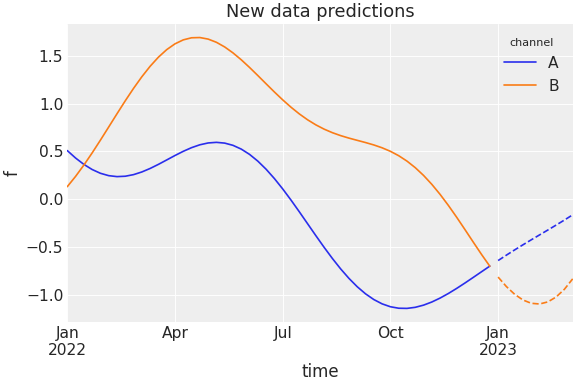
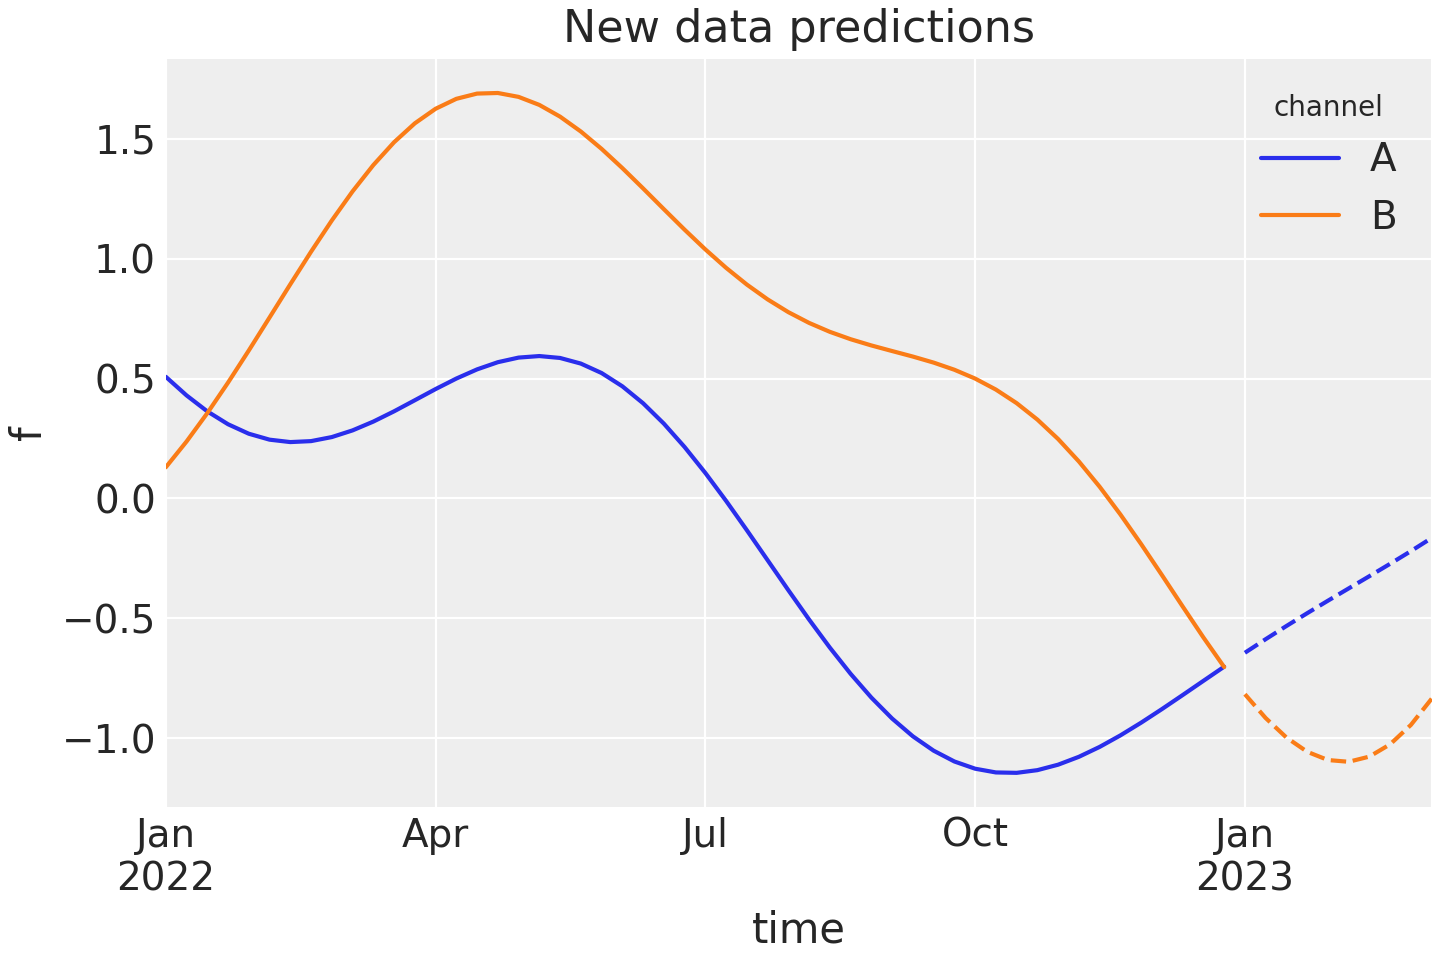
New data predictions with HSGP
import numpy as np
import pandas as pd

import pymc as pm

import matplotlib.pyplot as plt

from pymc_marketing.mmm import HSGP
from pymc_extras.prior import Prior

seed = sum(map(ord, "New data predictions"))
rng = np.random.default_rng(seed)

eta = Prior("Exponential", lam=1)
ls = Prior("InverseGamma", alpha=2, beta=1)
hsgp = HSGP(
    eta=eta,
    ls=ls,
    m=20,
    L=150,
    dims=("time", "channel"),
)

n = 52
X = np.arange(n)

dates = pd.date_range("2022-01-01", periods=n, freq="W-MON")
coords = {"time": dates, "channel": ["A", "B"]}
with pm.Model(coords=coords) as model:
    data = pm.Data("data", X, dims="time")
    hsgp.register_data(data).create_variable("f", xdist=True)
    idata = pm.sample_prior_predictive(random_seed=rng)

prior = idata.prior

n_new = 10
X_new = np.arange(n, n + n_new)
new_dates = pd.date_range("2023-01-01", periods=n_new, freq="W-MON")

with model:
    pm.set_data(
        new_data={
            "data": X_new,
        },
        coords={"time": new_dates},
    )
    post = pm.sample_posterior_predictive(
        prior,
        var_names=["f"],
        random_seed=rng,
    )

chain, draw = 0, 50
colors = ["C0", "C1"]

def get_sample(curve):
    return curve.loc[chain, draw].to_series().unstack()

ax = prior["f"].pipe(get_sample).plot(color=colors)
post.posterior_predictive["f"].pipe(get_sample).plot(
    ax=ax, color=colors, linestyle="--", legend=False
)
ax.set(xlabel="time", ylabel="f", title="New data predictions")
plt.show()
(
Source code,png,hires.png,pdf)
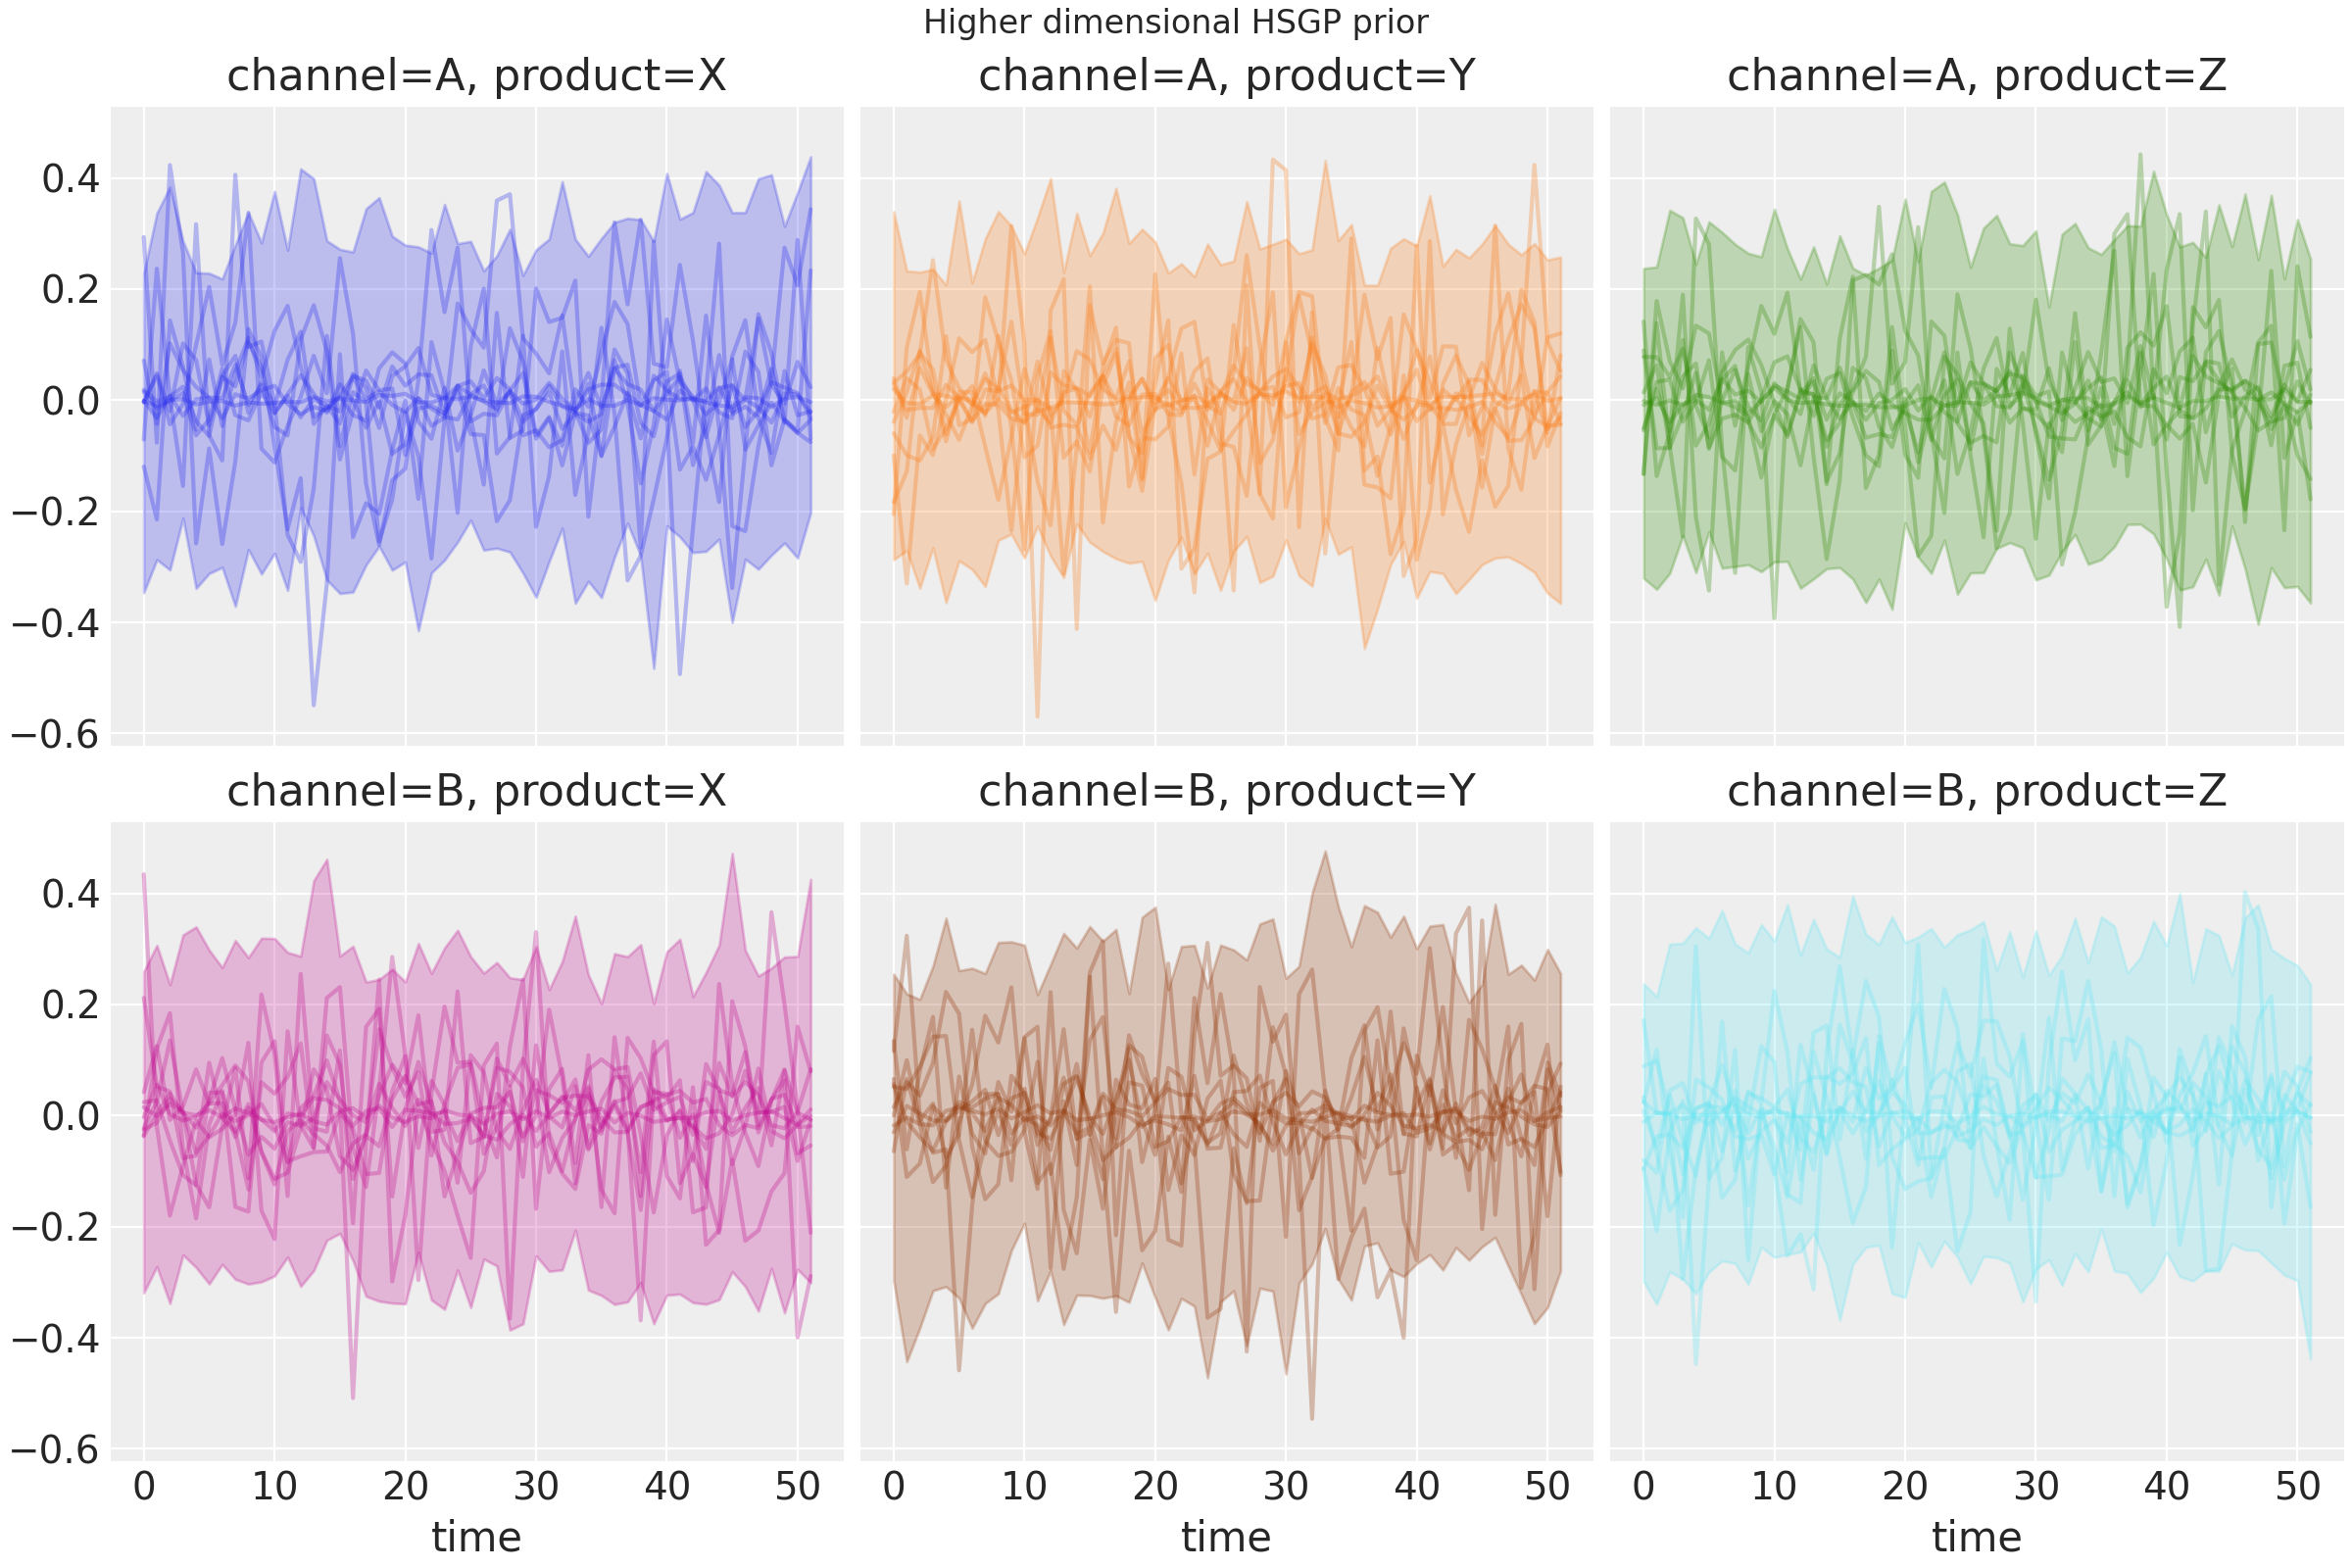
Higher dimensional HSGP
import numpy as np
import pymc as pm

import matplotlib.pyplot as plt

from pymc_marketing.mmm import HSGP

seed = sum(map(ord, "Higher dimensional HSGP"))
rng = np.random.default_rng(seed)

n = 52
X = np.arange(n)

hsgp = HSGP.parameterize_from_data(
    X=X,
    dims=("time", "channel", "product"),
)

coords = {
    "time": range(n),
    "channel": ["A", "B"],
    "product": ["X", "Y", "Z"],
}
prior = hsgp.sample_prior(coords=coords, random_seed=rng)
curve = prior["f"]
fig, _ = hsgp.plot_curve(
    curve,
    random_seed=rng,
    subplot_kwargs={"figsize": (12, 8), "ncols": 3},
)
fig.suptitle("Higher dimensional HSGP prior")
plt.show()
(
Source code,png,hires.png,pdf)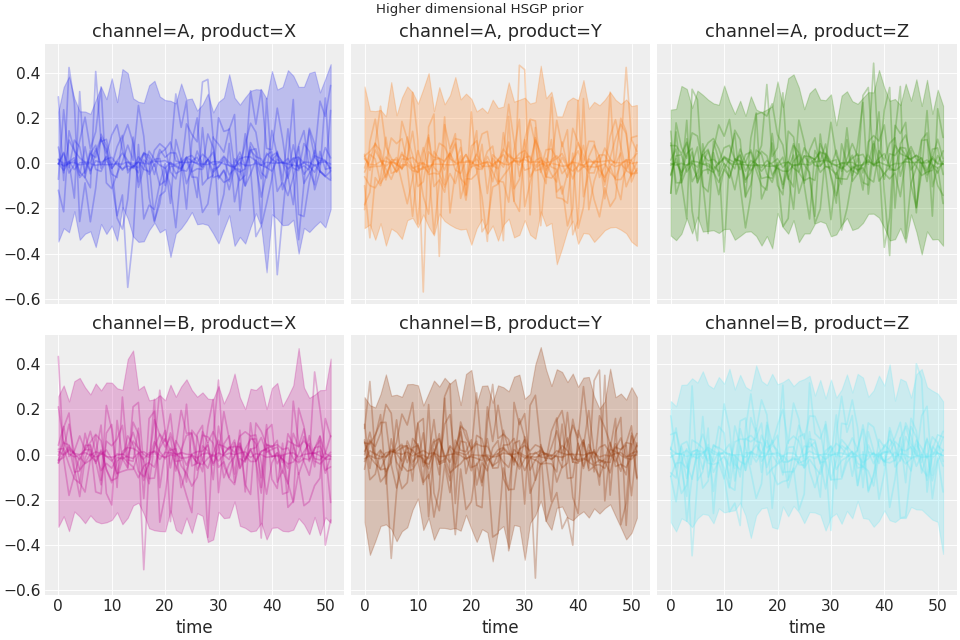
Methods
HSGP.__init__(**data)Create a new model by parsing and validating input data from keyword arguments.
HSGP.create_variable(name[, xdist])Create a variable from HSGP configuration.
Name of the Deterministic variables that are replaced with pm.Flat for out-of-sample.
HSGP.from_dict(data)Create an object from a dictionary.
HSGP.parameterize_from_data(X, dims[, ...])Create a HSGP informed by the data with literature-based recommendations.
HSGP.plot_curve(curve[, n_samples, ...])Plot the curve.
Register the data to be used in the model.
HSGP.sample_prior([coords])Sample from the prior distribution.
HSGP.to_dict([_orig])Convert the object to a dictionary.
- field X: InstanceOf[XTensorVariable] | InstanceOf[DataArray] | InstanceOf[np.ndarray] | None = None[source]#
The data to be used in the model
- field eta: InstanceOf[VariableFactory] | DeferredFactory | float [Required][source]#
Prior for the variance
- field ls: InstanceOf[VariableFactory] | DeferredFactory | float [Required][source]#
Prior for the lengthscales